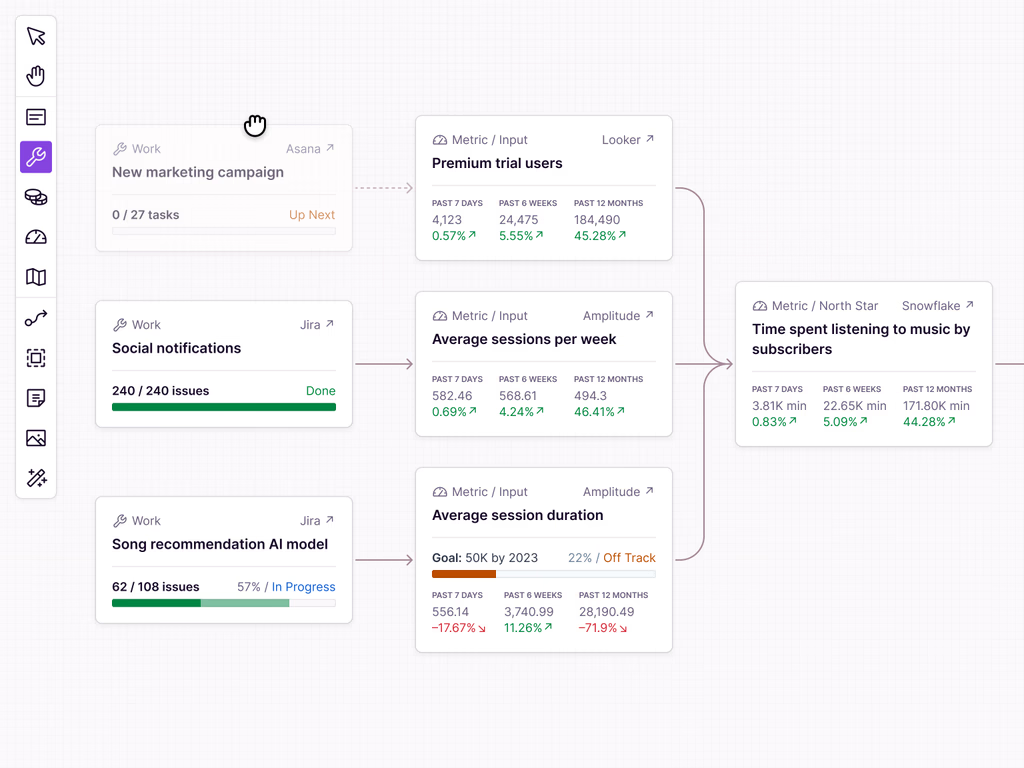
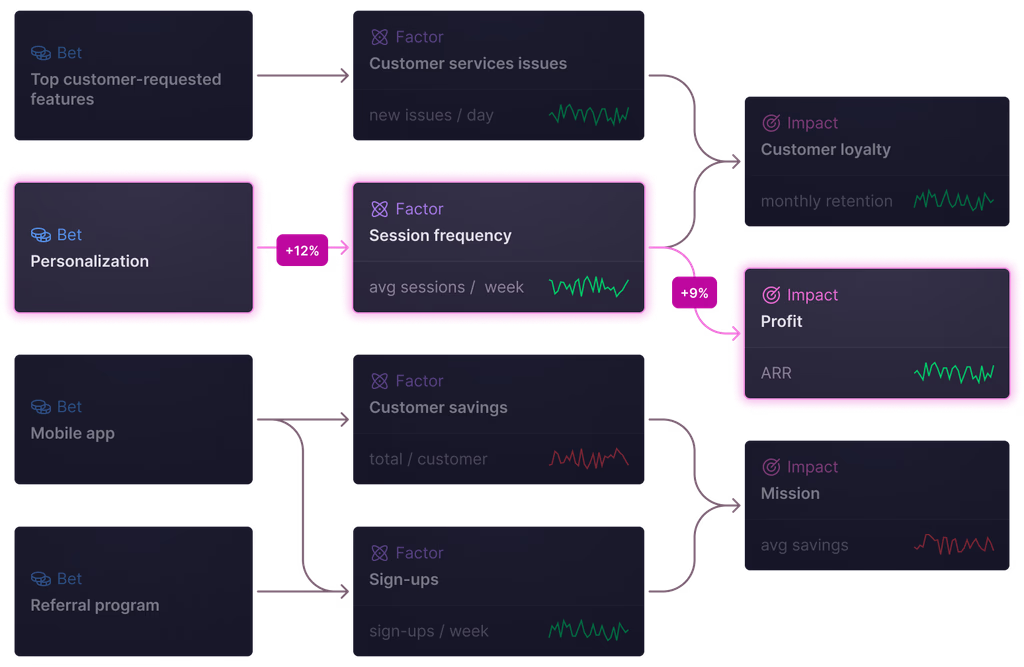
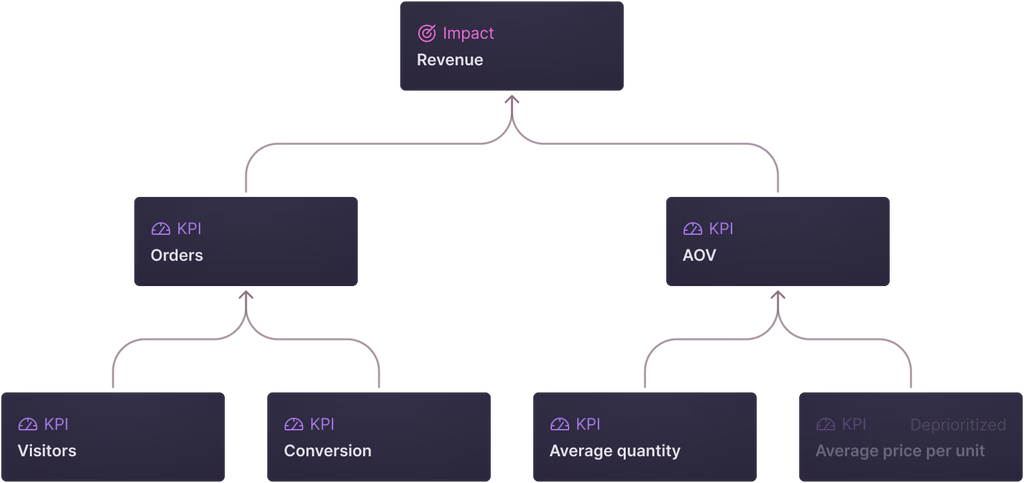
Five years ago, we founded DoubleLoop to help product teams escape the feature factory and drive impact. Along the way, we discovered that the real unlock was AI-powered metric trees — connecting everyday work to business outcomes.
As adoption grew, it became clear that to realize their full potential, metric trees needed to live inside the systems teams already use, fueled by richer data and scale. That's why we're excited to share that DoubleLoop has been acquired by Mixpanel.
Inside Mixpanel, metric trees won't just be standalone artifacts. Powered by richer behavioral, revenue, and experiment data, they become a living metric layer that evolves with your business and provides context for the next best action. Together, we're building the first truly intelligent system for product strategy — one that adapts in real time to user behavior, acting like a co-pilot that not only shows where you are but also suggests the best route to your business goals.
For our current customers: the DoubleLoop product will remain available in the near term, and you can continue using it as usual. Looking forward, our focus and future development are moving into Mixpanel, where Metric Trees and AI can deliver their full potential.
We're deeply grateful to our customers, investors, and community who believed in this vision from the start. This is just the beginning — and we can't wait to keep building.
- DoubleLoop Team