

The DoubleLoop Method
Develop a strategy with impact
Why strategy is hard: The messy middle problem
Even with a clear mission and vision, most organizations struggle to develop an impact-oriented strategy. The root cause is the “messy middle problem” — the gulf between work and impact.

It’s impossible to directly influence the factors that matter to the long-term health of an organization — e.g., lag measures such as profit, customer acquisition, customer retention, etc. Consequently, the teams doing the hands-on work struggle to understand why their work matters or ladders up to the organization’s KPIs.
The messy middle problem leads to a bunch of organizational challenges: Teams drown in data but can’t act upon it, roadmaps become a power struggle, OKRs become glorified to-do lists, employees lose confidence in the strategic direction, and initiatives pour money down the drain when they don’t create meaningful impact.
Solving the messy middle problem can feel difficult to overcome because the inputs and outputs of the organization can feel like a black box that is impossible to decode. Often this is because everyone has a different mental model for how their organization works — or, more commonly, strategic assumptions aren’t discussed at all.
This means that teams often spend tireless cycles aligning on goals and roadmaps without first spending the time to align on impact drivers. Consequently, they get stuck in circles of surface-level arguments instead of getting down to the root of their misalignment so they can make forward progress.
When organizations don’t understand how actions they take actually influence the impact they want to create, they can do a lot without getting anywhere — the end result is that many organizations operate like a hamster wheel.
Maximize your impact with the DoubleLoop Method
We created the DoubleLoop Method to address the messy middle problem by helping organizations create a visual strategy map: A clear, shared hypothesis for what will drive impact. Just like agile development brought a scientific approach to product development, our approach brings a scientific lens to strategy development.
DoubleLoop's approach to scientific strategy development is groundbreaking.

Quote (Eric)
Author of The Lean Startup
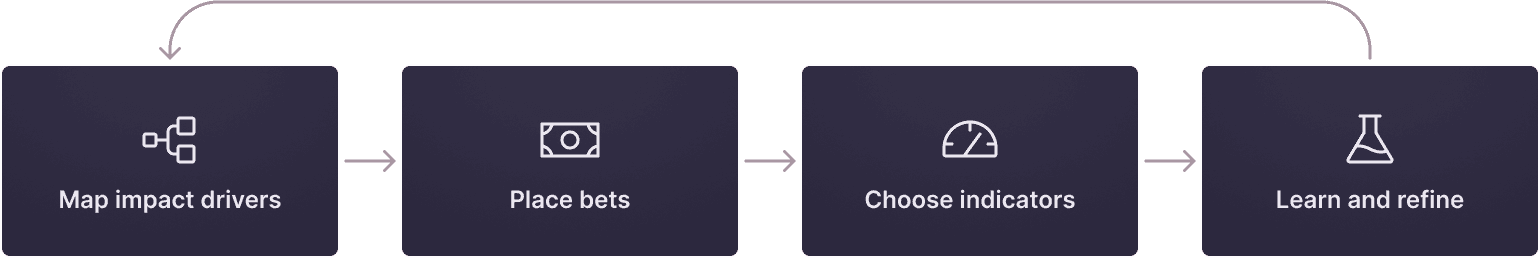
The DoubleLoop Method is an iterative approach to strategy development that optimizes for deep alignment and learning speed. Apply the method to collaboratively hypothesize, test, and refine your strategy so you can maximize your impact. It has the following phases:
Map your impact drivers
At most organizations, the same strategic tensions pop up insidiously and repeatedly when prioritizing projects. With the DoubleLoop Method, you visualize your strategic tensions up front so you can address any misalignment at its core.
By mapping out the factors that could lead to the impact you want to create, teams can align on shared hypotheses of which impact drivers have the highest likelihood and magnitude of success.
There are many frameworks for mapping out this kind of model, so make sure you choose a framework that’s best suited to your situation. Here’s a quick overview of some common frameworks:
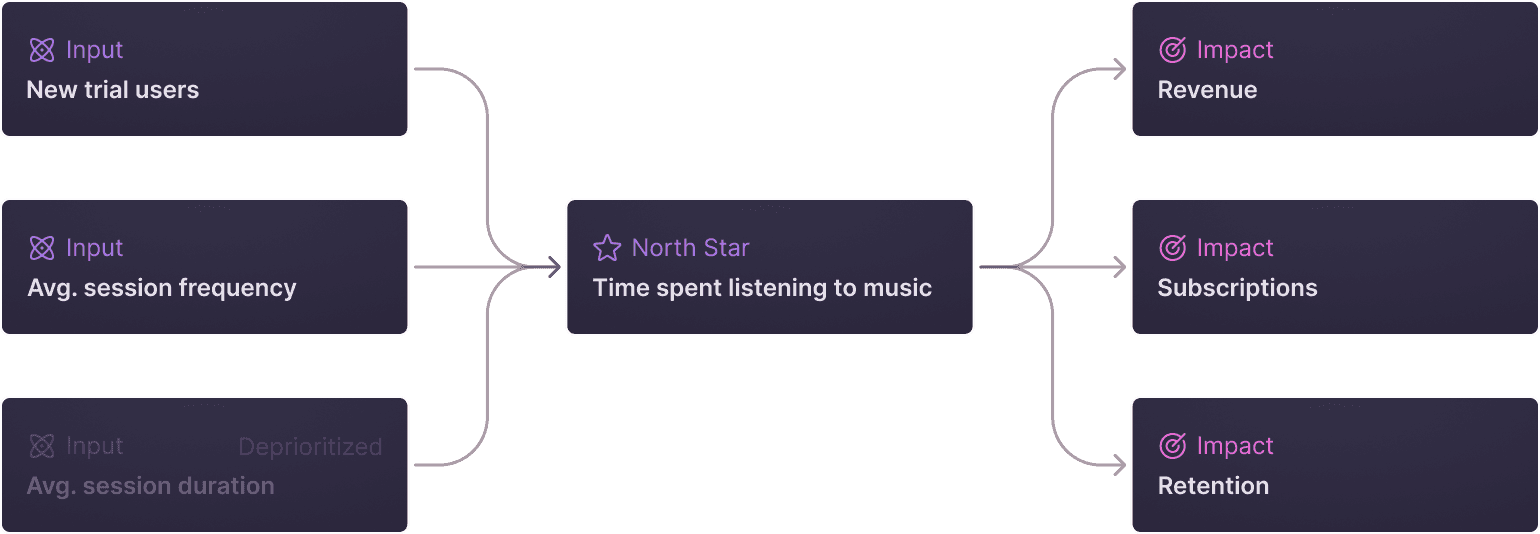
North Star Framework
Useful when the primary challenge is retaining more users
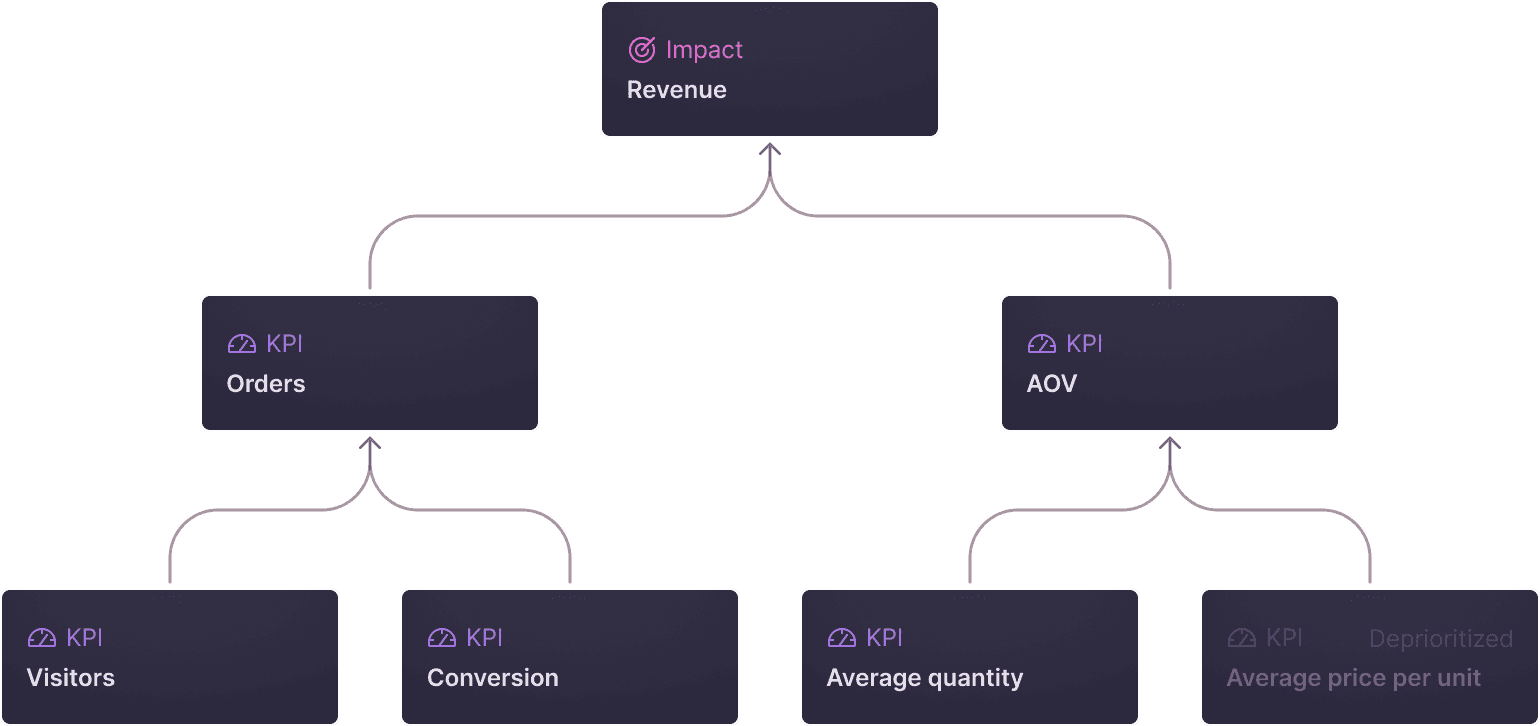
KPI trees
Useful for identifying the largest revenue opportunities
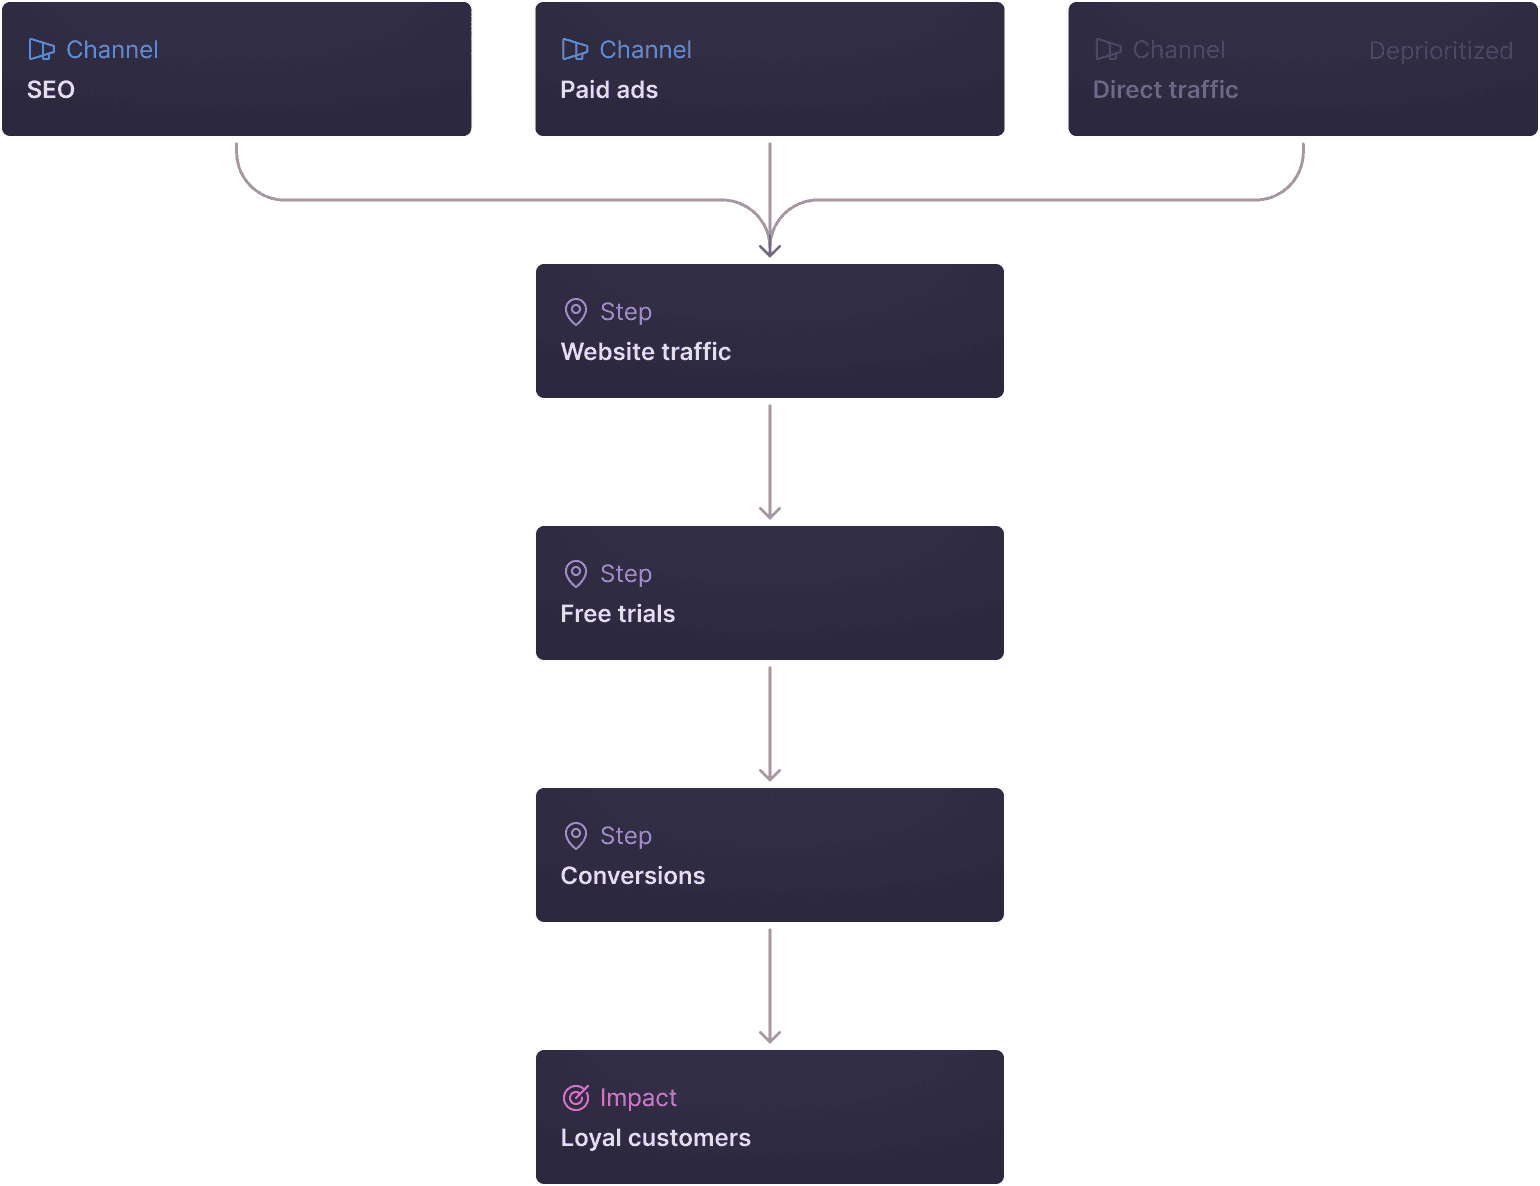
Customer journey maps
Useful when the primary challenge is optimizing an acquisition funnel or increasing activation
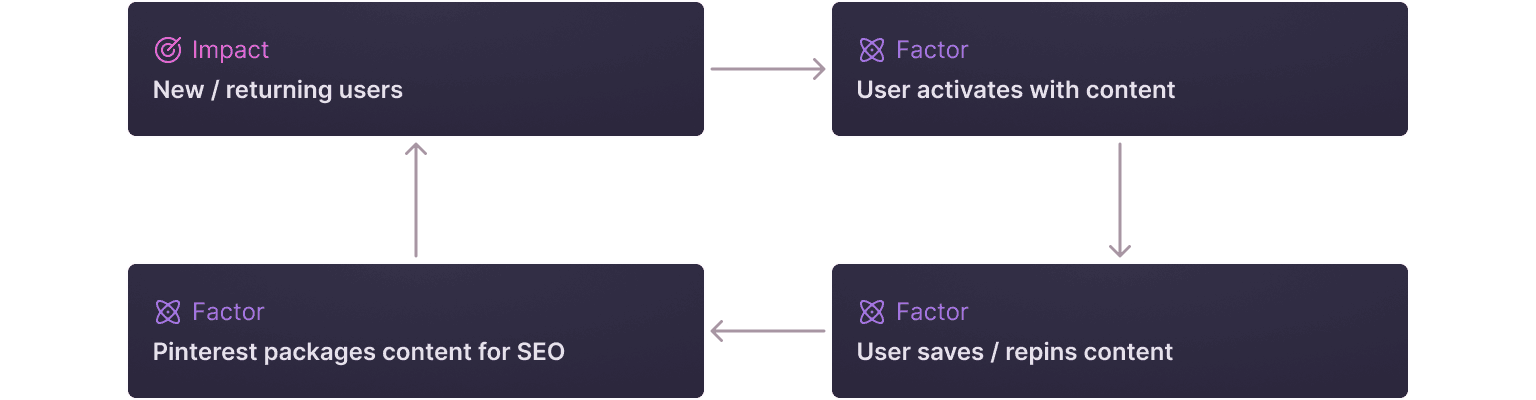
Growth loops
Useful for companies who are creating network effectiveness
Typically, you can use one of two approaches for building a visual model like this: You can either work backward from the impact you’re trying to create or work forward from your in-flight work:
Working backward: Start from the impact you’re trying to create (which should be informed by your organization’s shared values, mission, and financial goals) and work backward to develop a hypothesis of the chain of factors that will help you create that impact. This approach can be great if you’d prefer to start from first principles.
Working forward: Start by clarifying the hypotheses of your in-flight work to map out the factors your work is attempting to influence. Use those initial factors to develop a hypothesis for the chain of factors that could lead toward the impact you’re trying to create. This approach can be great to get a rough model on paper that you can iterate on.
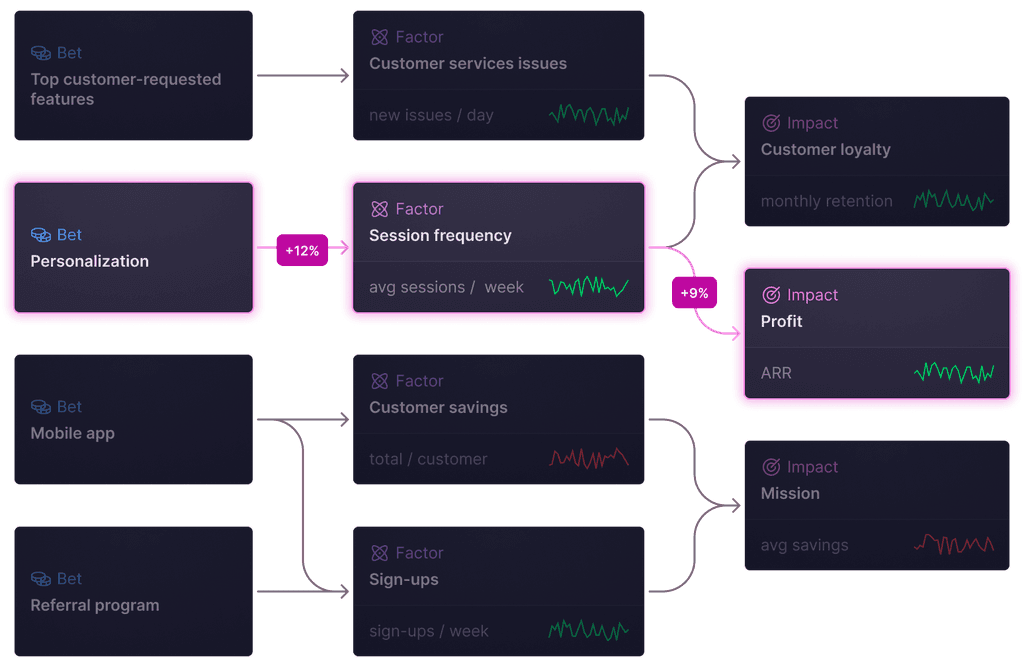
Map bets to your impact drivers
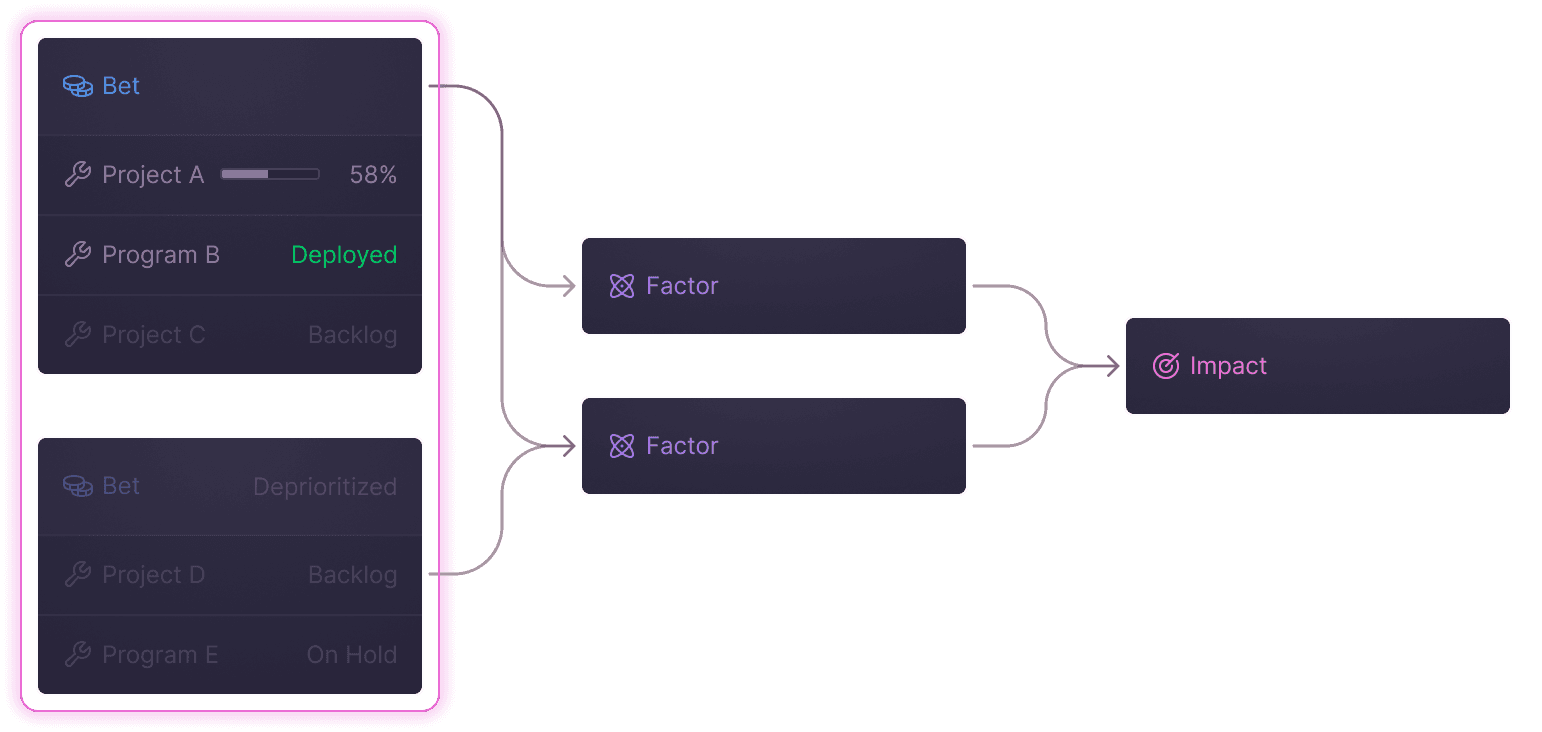
When you’re deploying something new, you can't be certain of its impact — you might have a hypothesis, but you don’t have a guarantee. This is why we recommend using the term “bet” to refer to a collection of related work instead of a term like “initiative”. It acknowledges the uncertainty present while also encouraging you to review your return on investment, which is critical for learning.
Your map of impact drivers provides the perfect context to explain the hypotheses of your bets because each bet can target one or more impact drivers. To get the full picture, it can be helpful to map out not only bets representing the work you’re already doing, but also future bets you’re considering as well as bets you’ve recently completed (so you can keep them in mind to track the impact they’re having out in the world).
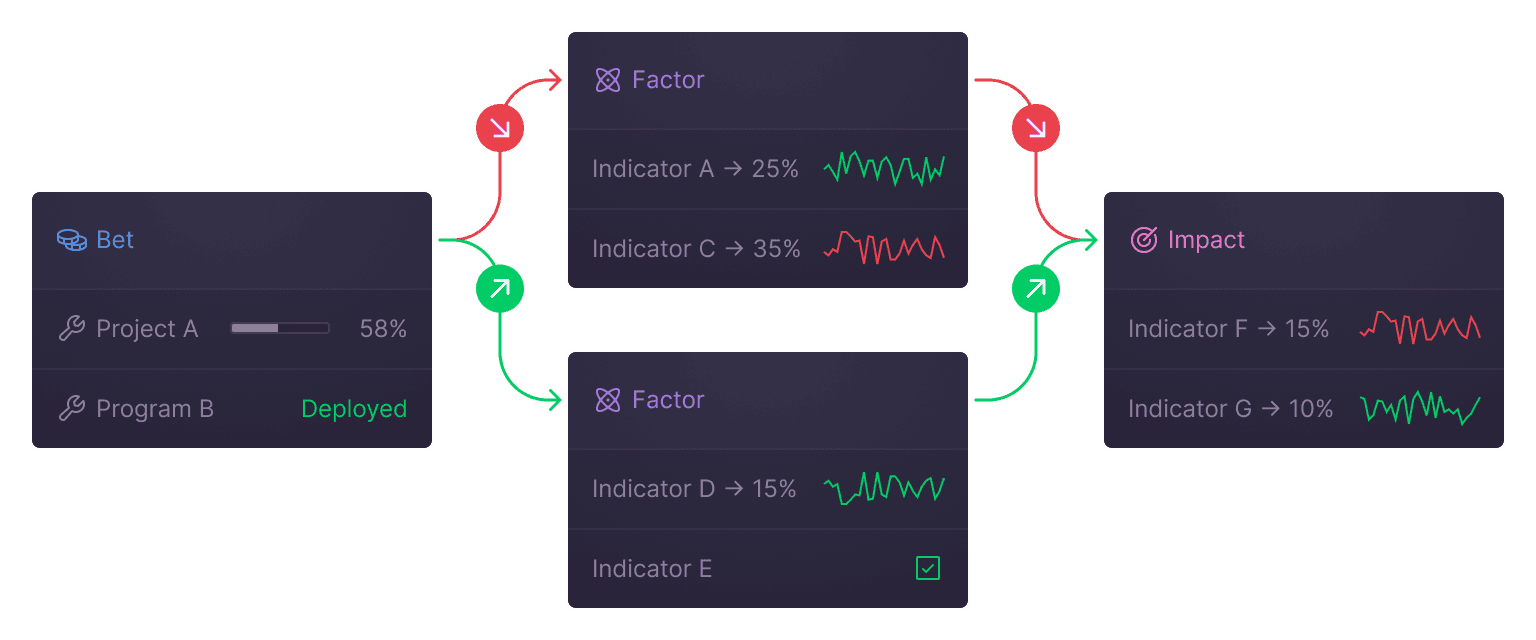
Once you’ve visualized how your bets are expected to influence your impact drivers you’ll have a visualization of your strategy, which we call a “strategy map”.
Keep track of important milestones or events that result from your work (e.g., feature releases, campaign launches, etc.) that could mark when you might start seeing shifts in your impact drivers.
Choose indicators of impact
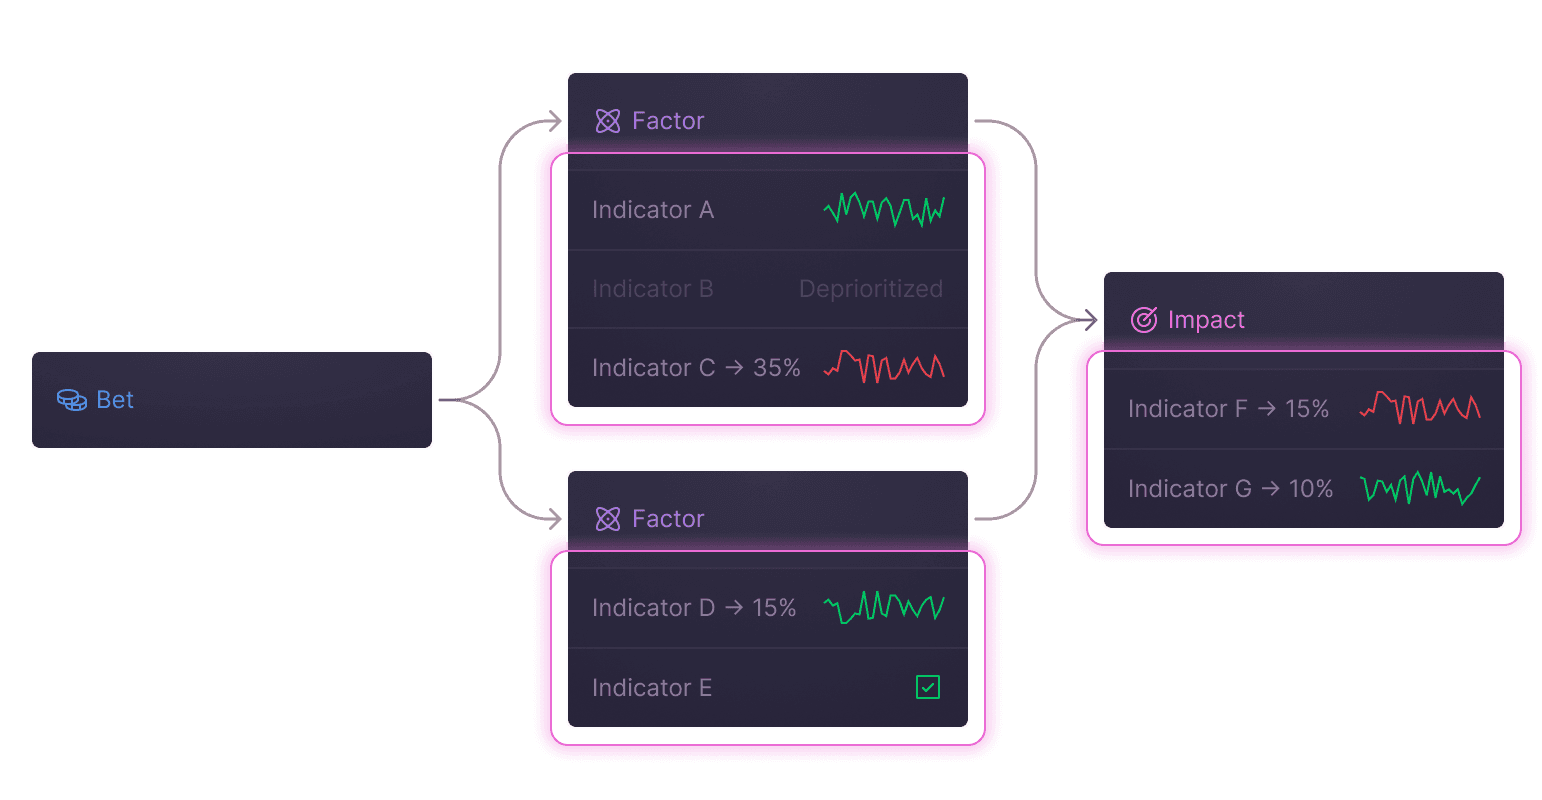
Choose specific quantitative and/or qualitative methods for evaluating how you’re influencing the factors in your model (eg, by instrumenting software for analytics, deploying a survey, interviewing stakeholders, etc) — ideally before you begin working on your bets, so it informs what your work optimizes for while also giving you the time to develop a baseline to compare against.
For example, to evaluate how often users are using your product, you could measure the daily, weekly, and monthly average users. To better understand retention, you could send out an exit survey to customers to better understand what factors cause them to stop using your product.
Quantitative indicators associated with factors later in the chain are typically called “output metrics”, and those associated with factors earlier in the chain are typically called “input metrics”. Some output metrics such as financial KPIs are often shared across organizations, whereas most input metrics (which are typically associated with products or programs) are usually a bit more domain-specific. There’s an art to developing good input metrics, and it’s especially important to identify the ones that are predictive of long-term impact.
It’s critical to not let perfect be the enemy of good — it will be impossible to gather all the evidence you might want. Start with just a few indicators, balancing out considerations such as feasibility, implementation cost, accuracy, precision, etc. You refine and build upon these as you learn where you have significant blind spots.
Once you’ve identified your evaluation methods, you can optionally set specific goals for each indicator (e.g., “achieve a 15% increase in monthly recurring revenue since the beginning of the quarter”). Unlike a typical OKR process, we don't recommend that you create key results for all of your objectives — in many cases, you are learning what type of impact you can have and it’s premature to set a target.
Learn what’s working and refine your strategy
Gather and analyze quantitative and/or qualitative evidence to show how much your bets are influencing your indicators, and use what you learn to refine your hypothesis.
For example, maybe you found that your business model didn’t account for a factor that you’re realizing is important to include. Or maybe you found that a project you invested in actually negatively influenced a business driver. Or maybe an indicator needs to be adjusted to more accurately capture how much you’re influencing a factor.
Use these insights to refine your strategy map for your next round of strategic execution. Adjust your model at the rate of your learning process — you don't need to wait for the next quarterly planning cycle.
Get started today
It can feel difficult to carve out time for strategic thinking when you’re feeling overwhelmed by all the responsibilities and pressures you may need to juggle — don’t fall into this trap. It doesn’t take a huge investment of time to get started (typically only a few hours of work to start seeing the benefits of our approach).
If you’re intrigued by our method and want help getting started, schedule a free workshop with one of our advisors — we’d love to help you maximize your impact.
